Ephemeris Downloader
[1]:
import numpy as np
import gnss_lib_py as glp
from datetime import datetime, timezone
The load_ephemeris function from the utils/ephemeris_downloader.py file can be used to automatically download ephemeris files and check whether the correct ephemeris files have already been downloaded.
As an example, say we want to find satellite positions for a specific location and time. We will use load_ephemeris to download the correct ephemeris files.
[2]:
lat, lon, alt = 37.42984154652992, -122.16946303566934, 0.
timestamp_start = datetime(year=2023, month=3, day=14, hour=12, tzinfo=timezone.utc)
timestamp_end = datetime(year=2023, month=3, day=14, hour=13, tzinfo=timezone.utc)
To download ephemeris simply pass in the file type you want to download (either sp3, clk, or rinex_nav and the time at which you want the ephemeris in units of GPS milliseconds. The output of the load_ephemeris function is the path to the ephemeris files.
[3]:
gps_millis = glp.datetime_to_gps_millis(np.array([timestamp_start,timestamp_end]))
sp3_path = glp.load_ephemeris(file_type="sp3",
                              gps_millis=gps_millis,
                              verbose=True)
ephemeris dates needed: [datetime.date(2023, 3, 14)]
FTP downloading /gnss/products/2253/COD0MGXFIN_20230730000_01D_05M_ORB.SP3.gz from gdc.cddis.eosdis.nasa.gov
using previously downloaded file:
 /home/docs/checkouts/readthedocs.org/user_builds/gnss-lib-py/checkouts/latest/docs/source/tutorials/utils/data/ephemeris/sp3/COD0MGXFIN_20230730000_01D_05M_ORB.SP3
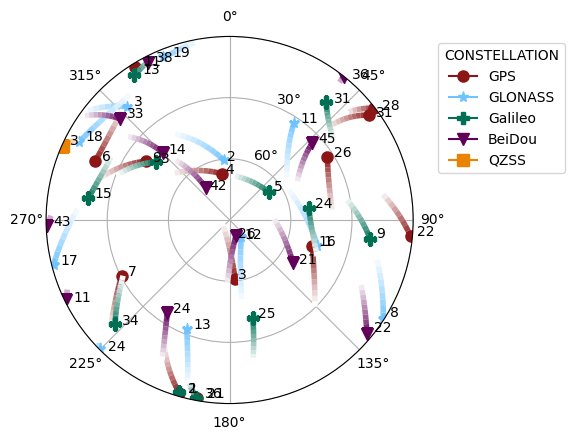
To visualize the data, we can then plot the satellite positions using a skyplot from our receiver’s location we input above. For the skyplot we need to parse the sp3 file we downloaded using the Sp3 class and then create a NavData instance to pass in our receiver’s position.
[4]:
# load the sp3 file
sp3 = glp.Sp3(sp3_path)

# create receiver state NavData instance to pass into skyplot function
x_rx_m, y_rx_m, z_rx_m = glp.geodetic_to_ecef(np.array([[lat,lon,alt]]))[0]
receiver_state = glp.NavData()
receiver_state["gps_millis"] = glp.datetime_to_gps_millis(timestamp_start)
receiver_state["x_rx_m"] = x_rx_m
receiver_state["y_rx_m"] = y_rx_m
receiver_state["z_rx_m"] = z_rx_m
Now we can plot the skyplot from the downloaded data. For readability, we crop the sp3 data to only include satellite positions between the start and end timestamp from above.
[5]:
cropped_sp3 = sp3.where("gps_millis",gps_millis[0],"geq").where("gps_millis",gps_millis[1],"leq")
fig = glp.plot_skyplot(cropped_sp3,receiver_state)
